SPORTIVO

Hockey · AI Performance Analysis

ASHFORD HIGH SCHOOL GIRLS 1st XI  v  BAYSIDE HIGH SCHOOL GIRLS 1st XI
22 AUG 2026  ·  WON 2–1  ·  28 PAGES  ·  PLAYER CODING

The report starts with

“Ashford beat Bayside 2–1 in a match they controlled territorially but not comfortably.”

37 entries to 21 and 25 circle entries to 14 — turned into 2 goals from 8 shots and corners. The report names the gap as decision-making in the circle, not territory.

Q1 0–0Scoreless. Both sides traded territory without a clear chance.
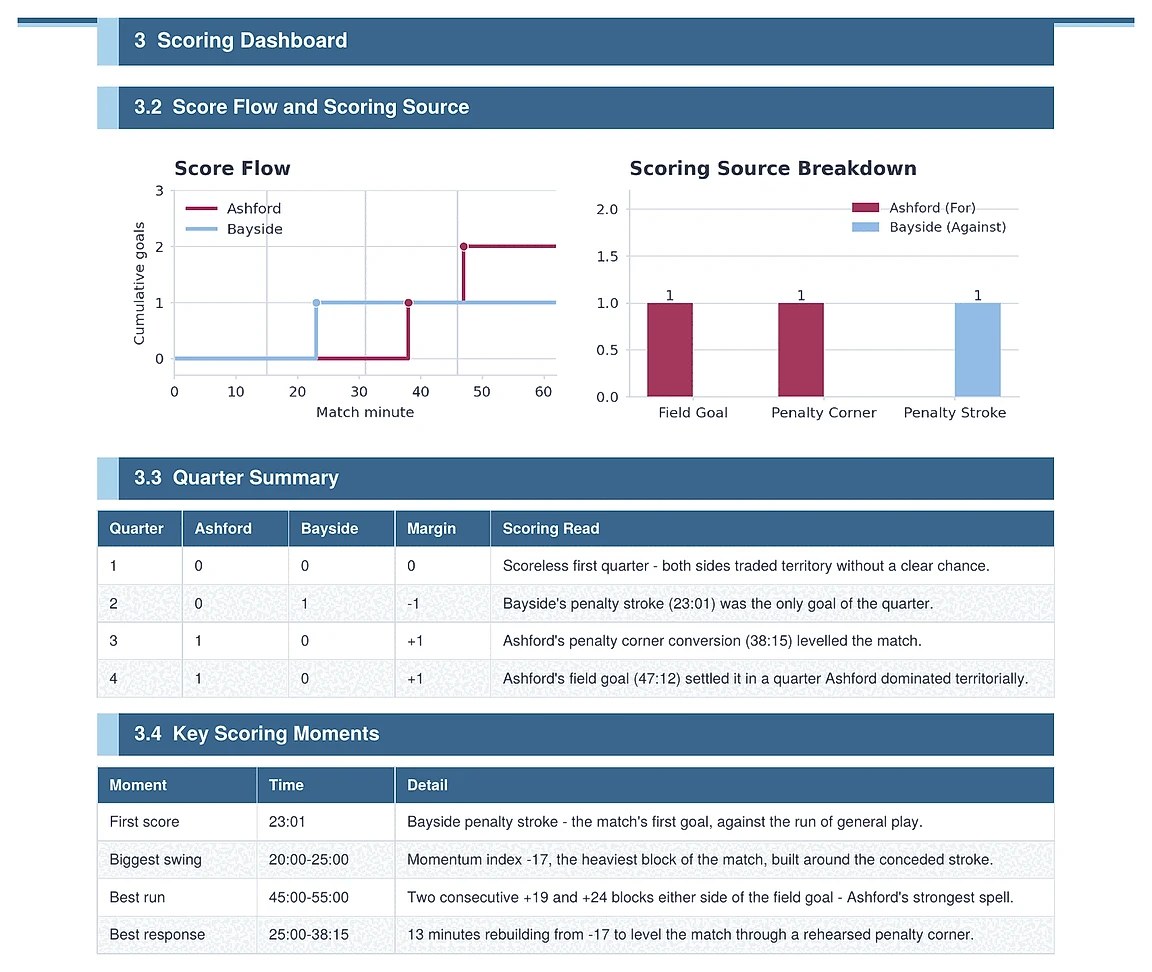
23:01Bayside penalty stroke, against the run of general play.
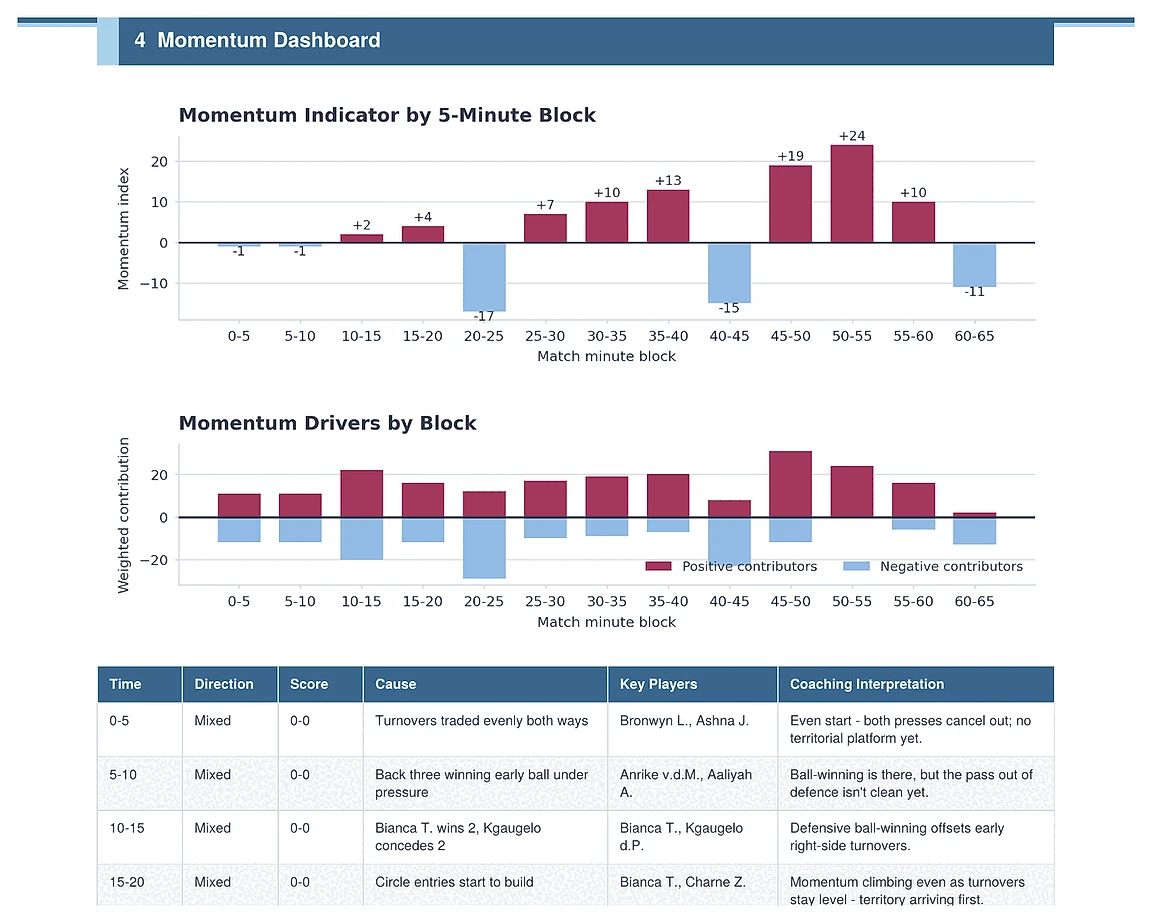
−17The 20–25 block — heaviest momentum swing of the match.
38:15A rehearsed penalty corner levels it, 13 minutes after the low point.
47:12Field goal settles a quarter Ashford dominated territorially.
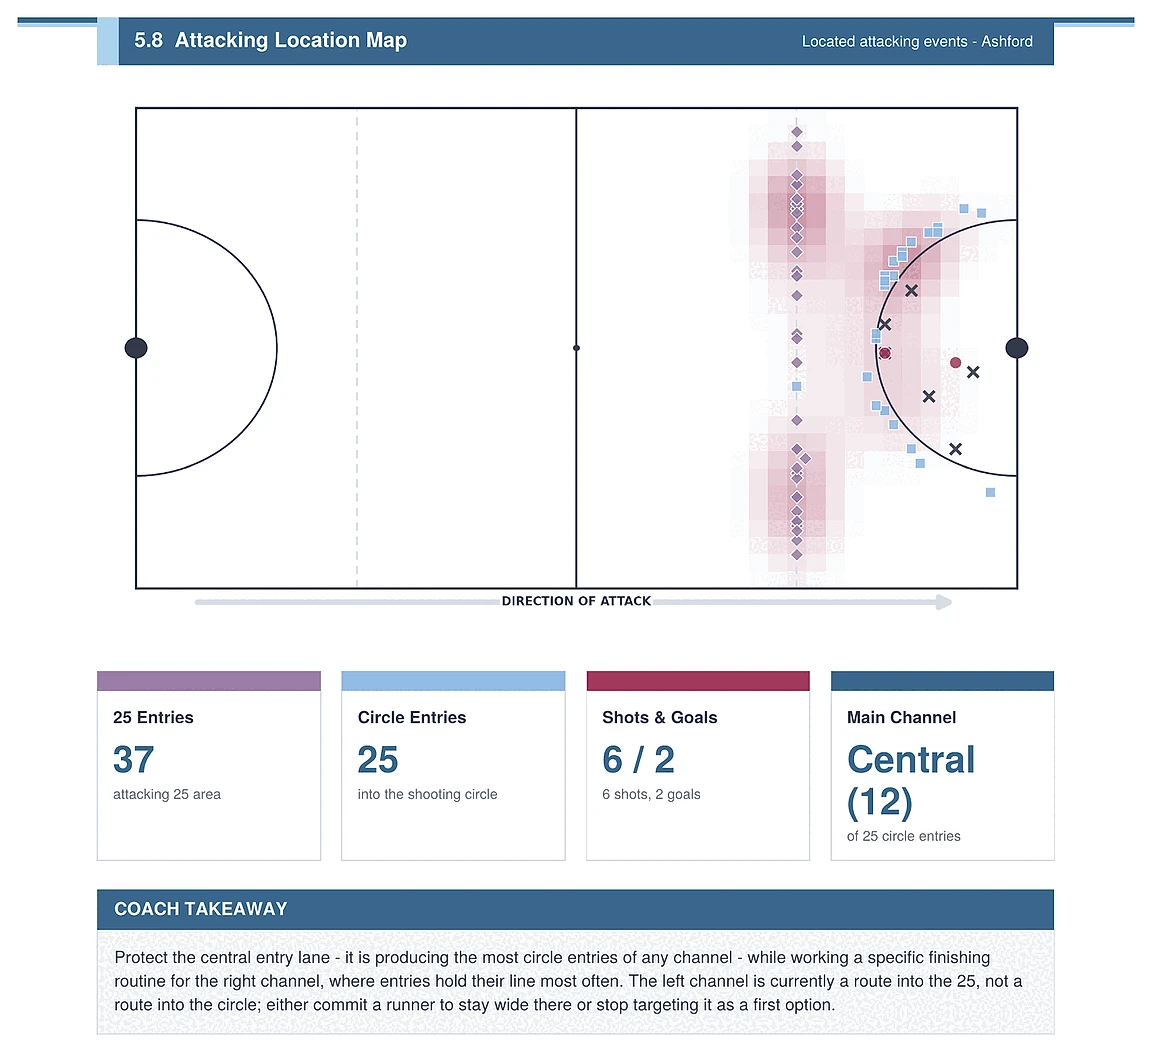
37/21Attacking 25 entries — 63.8% share
25/14Circle entries, for vs against
21.6%Entry conversion — 5 shots from 37 entries
49/47Turnovers won vs conceded, 27 by intercept
36.7%Outlet success — 11 of 30

What a hockey report looks like

Territory, the circle, and what happens between them.

25 entries, circle entries, outlet success, press actions and turnover method. Every measure is built for the pitch and named the way a hockey coach names it. What follows are real pages from a real report format.

Match KPI dashboard

Section 1 · page 1
Hockey match KPI tiles covering score, goals by source, entries, outlet success and turnovers
Why it mattersEach measure carries its qualifier underneath. “49 turnovers won” means little until you read that 27 of them came from intercepts.

Scoring dashboard

Section 3
Score flow chart, scoring source breakdown, quarter summary and key scoring moments
Why it mattersQuarter by quarter with a scoring read on each, then the 4 moments that decided it — first score, biggest swing, best run, best response — each with the match clock attached.

Momentum indicator

Section 4
Momentum indicator and momentum drivers charts by 5-minute block, with the block table
Why it mattersThe 20–25 block swung −17 around the conceded stroke. The 45–55 blocks ran +19 and +24 either side of the field goal — the strongest spell of the match.

Pitch-zone outcome profile

Section 12
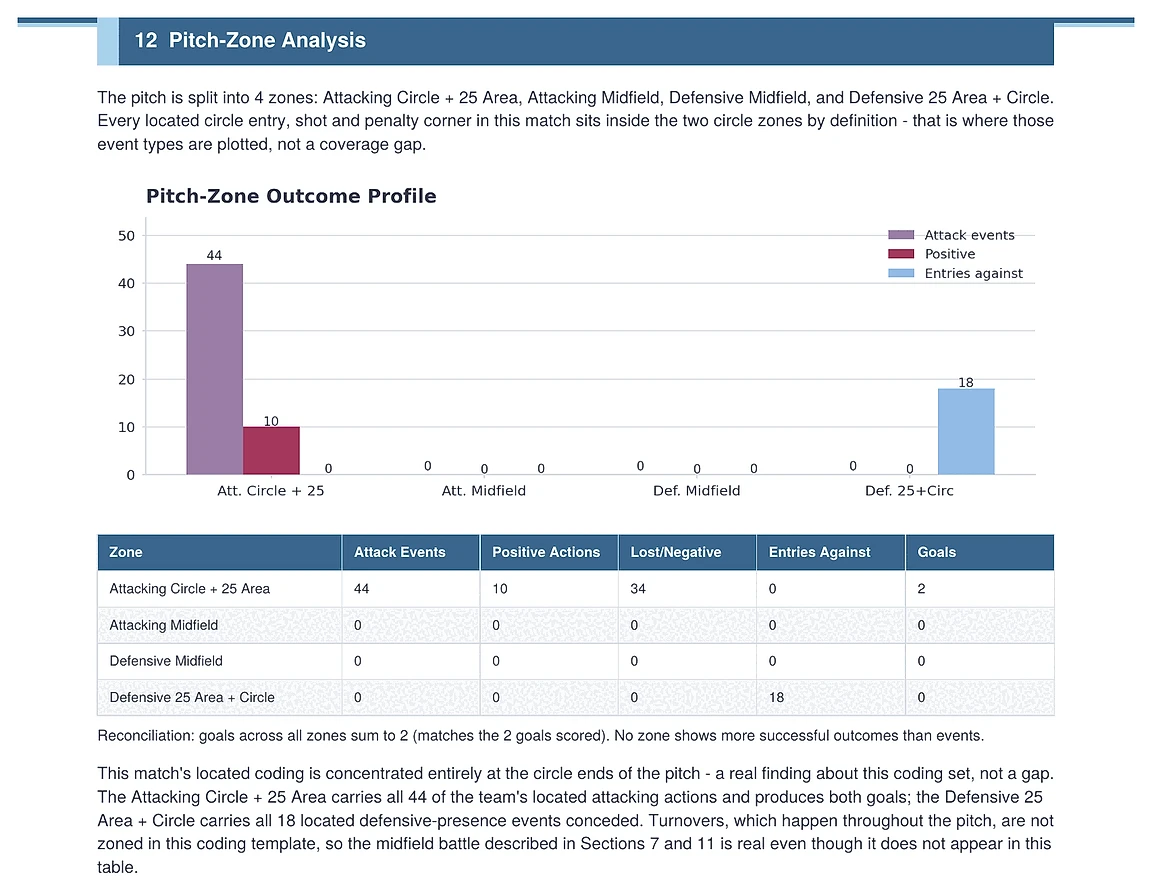
Pitch-zone outcome chart and table covering attack events, positive actions and entries against
Why it matters44 of the team’s located attacking actions sit in the attacking circle and 25 area, and both goals come from there. The report explains the empty midfield rows rather than leaving the coach to wonder.

Attacking location map

Section 5.8
Pitch map plotting every located attacking event with density shading
Why it mattersEvery located attacking event plotted on the pitch. The density sits in the central channel, and the report reads it as a finishing problem rather than a route problem.

Territory, entries and outlets

Section 9
Entry share, 25-to-circle rate, outlet success and turnover differential with supporting charts
Why it matters37 entries produced 5 shots. The entry conversion table sets that against Bayside converting at a similar rate from 21 entries but never winning a corner.

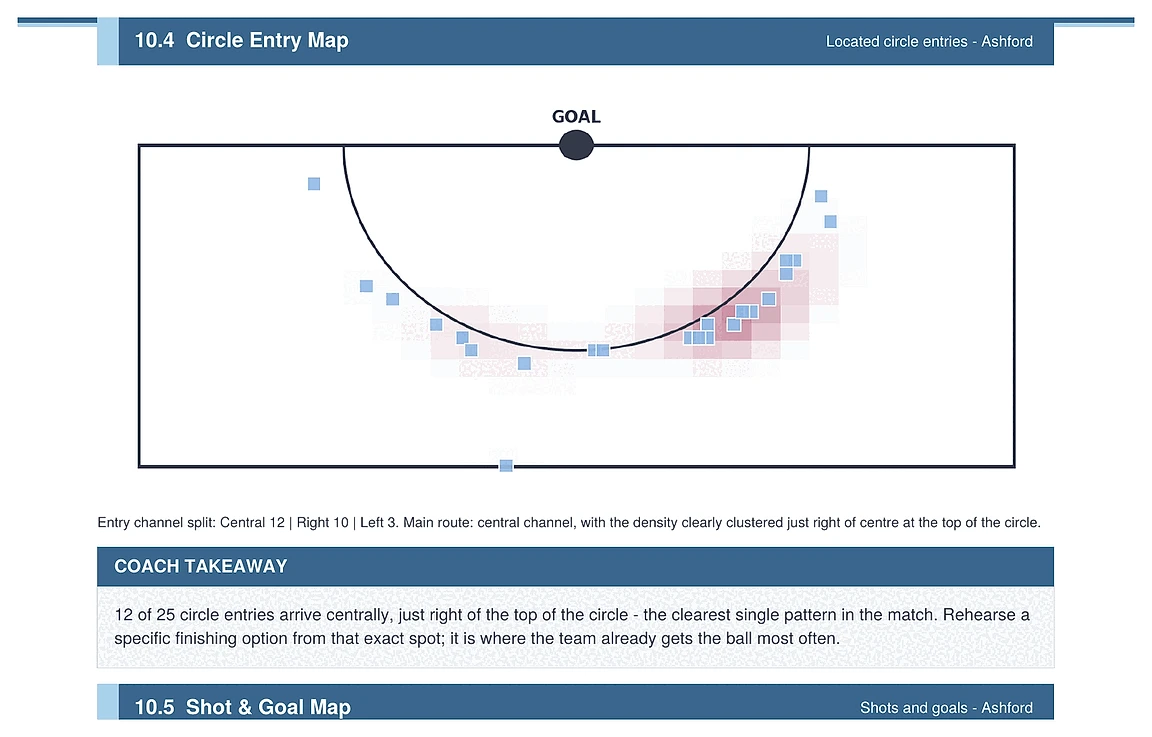
Circle entry map

Section 10.4
Goal circle map showing where located circle entries arrive, with density shading
Why it matters12 of 25 circle entries arrive centrally, just right of the top of the circle — the cleanest single pattern in the match, and a finishing routine waiting to be rehearsed.

Player impact summary

Section 14
Player impact indicator bar chart with the reason behind each player score
Why it mattersEvery coded, player-linked action netted into one indicator, with the reason behind each score spelled out beside it rather than left to interpretation.

Tactical plan

Section 16
Tactical plan: keep doing, fix urgently, match management rule and final tactical message
Why it mattersKeep doing, fix urgently, match management rule — then a final message written to be read out to the squad.

Contents

23 sections across 28 pages.

Every section carries a coaching interpretation. The 8 marked below are the ones shown on this page.

01Executive Summary and KPI Dashboardshown above
02Team Sheet
03Scoring Dashboardshown above
04Momentum Dashboardshown above
05Attacking Profile
06Attack Outcome Summary
07Defensive Profile
08Defensive Outcome Summary
09Territory, Entries and Outletsshown above
10Shooting, Circle and Penalty Cornershown above
11Discipline and Error Profile
12Pitch-Zone Analysisshown above
13Player and Unit Performance
14Player Impact Summaryshown above
15Unit Analysis
16Tactical Planshown above
17Training Focus
18Video Review / Playlist
19Momentum and Turning Points
20Final Coach Notes
21Player Development Focus
22Appendix A — Metric Definitions
23Data Notes and Limitations

How you get it

Code the match. Run the report. Download it.

Reporting is built into Sportivo. There is nothing to send and no one to wait for — player coding is what drives the depth, and it is what makes a workload chart, an impact indicator and an individual development focus possible.

Inside the platform

3 STEPS

  • Code the match in Sportivo as you already do
  • Run the report from the fixture — your line-up is already there
  • Download the PDF and take it into the review

Player coding

28 PAGES · 23 SECTIONS

  • Turnovers, shots and goals attributed to named players
  • Attacking and defensive workload per player
  • Unit analysis and individual development focus
  • Player impact summary with the reason behind every score

Built for the pitch

HOCKEY SPECIFIC

  • 25 entry and circle entry maps plotted on the pitch
  • Circle entry map showing exactly where the ball arrives
  • Outlet success split by attacking half and defensive quarter
  • Press actions and turnover method — intercept, tackle, bad pass

See what a hockey report says about your circle.

The Ashford v Bayside demonstration fixture, coded to player level. Real coded data, real analysis, no real school.

© Sportivo 2026 · Sportivo Performance Analysis Ashford High School and Bayside High School are demonstration fixtures. All players and results are fictional.