SPORTIVO

Netball · AI Performance Analysis

ASHFORD 1st TEAM  v  BAYSIDE 1st TEAM
21 AUG 2026  ·  WON 54–50  ·  37 PAGES  ·  PLAYER CODING

The report’s closing verdict

“Attack quality is not the priority for the next training block. The defensive circle is.”

Ashford won 54–50 on 85.7% shooting from 63 attempts — and conceded 60 penalties, 47 of them contacts, rising every quarter at 13, 13, 16, 18. Both readings come off the same coded match, in the same report.

Q1 18–108-goal lead. 21 circle feeds, the highest quarter.
Q2 9–18Circle feeds collapse to 12. Lead cut to 1 goal.
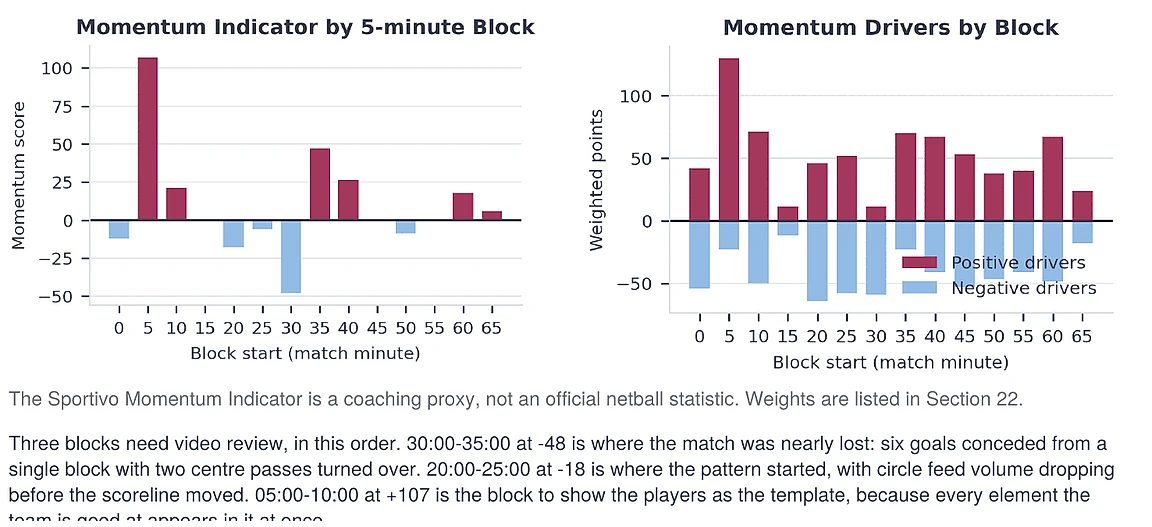
30:00Worst block of the match: 6 goals conceded, 1 scored.
Q3 15–11Control re-established on 20 circle feeds.
Q4 12–11Held on. 18 penalties conceded, the highest quarter.
85.7%Shooting accuracy — 54 goals from 63
69Circle feeds, 60 from just 2 players
37/53Centre pass conversion — 69.8%
17/20Turnover conversion — 85.0%
60Penalties conceded, 47 of them contacts

What a netball report looks like

Every measure is a netball measure.

Circle feeds, centre pass conversion, tips with gain, held ball, feed share. Every metric, chart and coaching read is built for the court and named the way a netball coach names it. What follows are real pages from a real report format.

Match KPI dashboard

Section 1 · page 1
Netball match KPI dashboard with 9 tiles covering score, shooting, conversion and penalties
Why it matters9 headline measures, each carrying its qualifier underneath. “54 goals” means little on its own; “54 from 63 attempts, 85.7%” is the finding.

Where the match was won and lost

Section 4 · 5-minute blocks
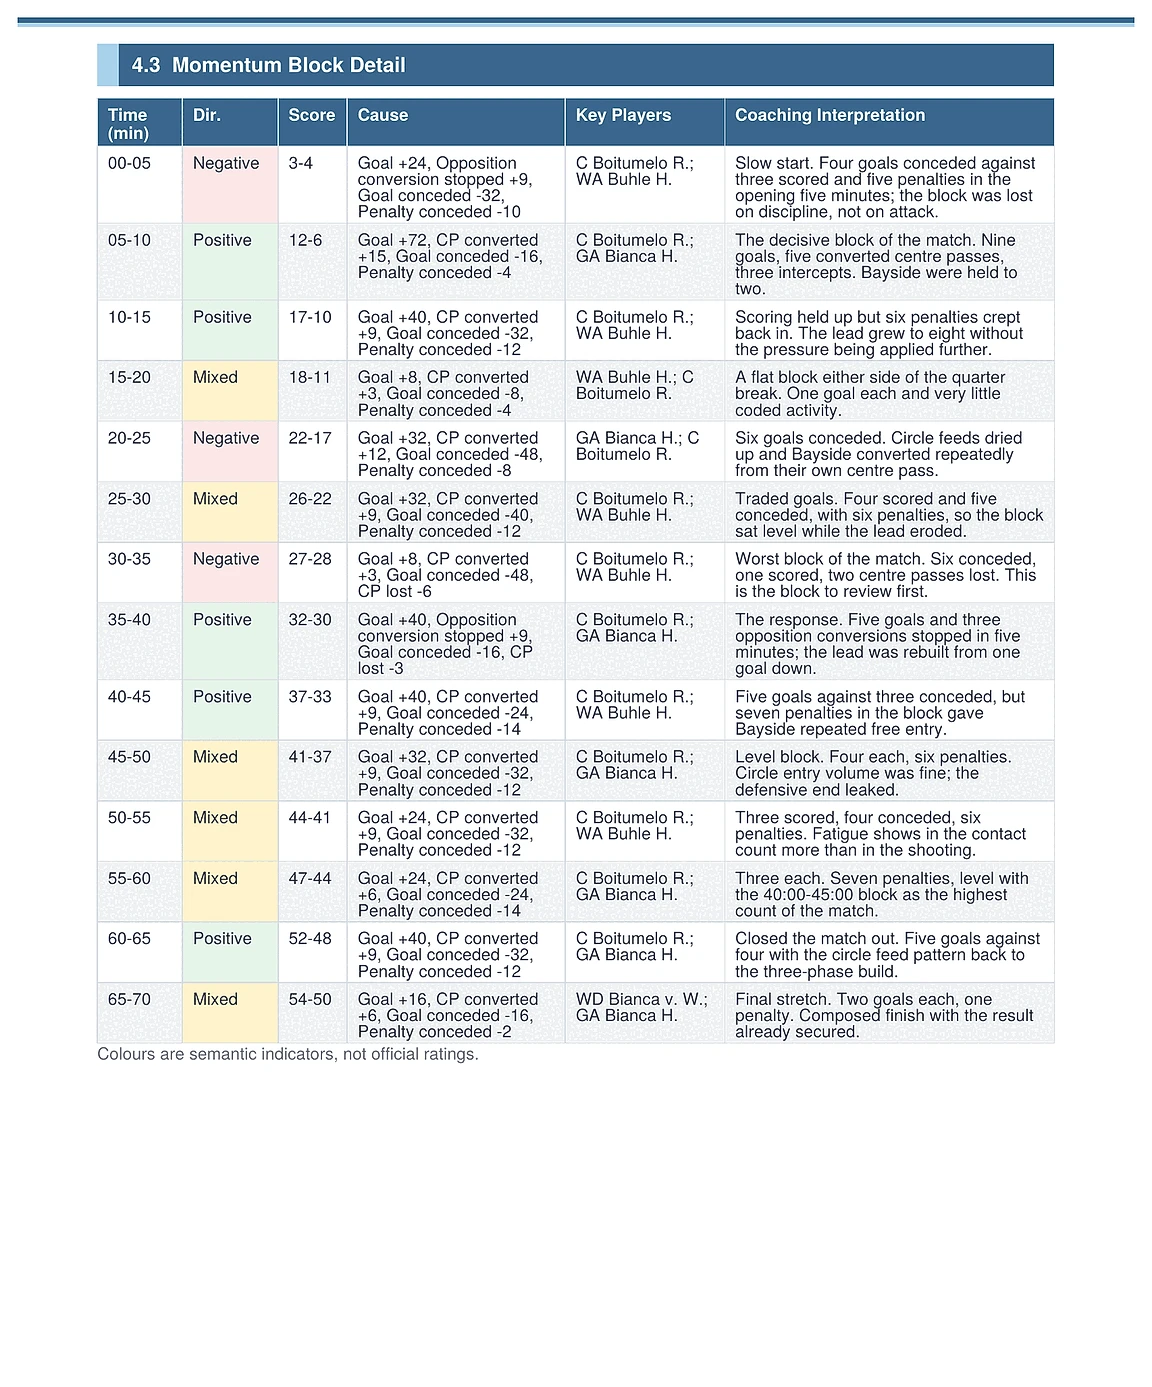
Table of 5-minute momentum blocks with cause, key players and coaching interpretation
Why it matters14 blocks, each naming the 2 largest positive and negative contributors and the players actually coded inside it. The 30:00 block is the first clip to watch.

Score flow and quarter summary

Section 3
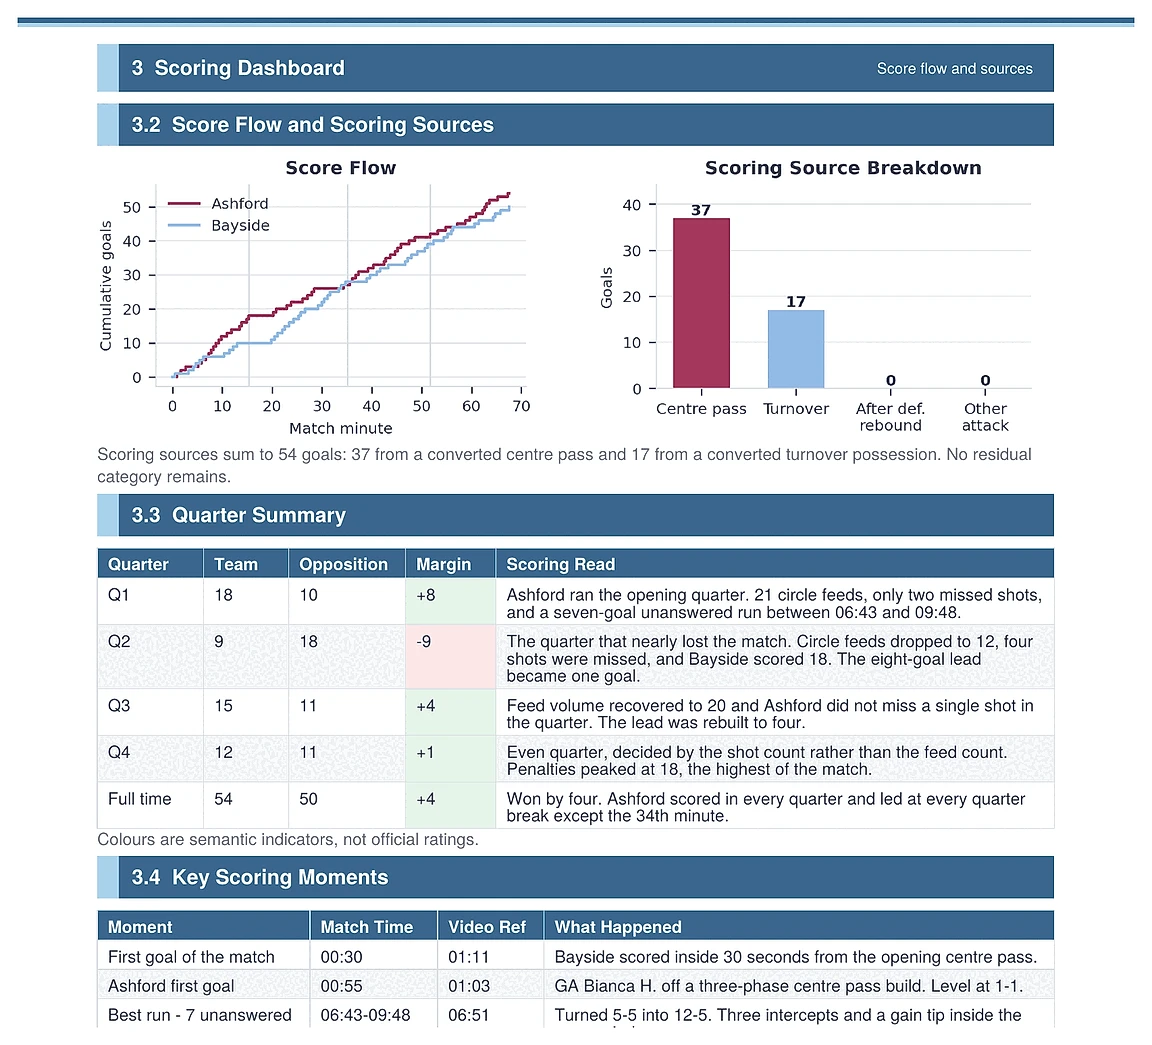
Score flow chart, scoring source breakdown, quarter summary table and key scoring moments
Why it mattersQuarter by quarter with a coaching read on each, then the key scoring moments with video timestamps attached.

Momentum indicator

Section 4
Momentum indicator and momentum drivers bar charts by 5-minute block
Why it mattersThe 30:00–35:00 block scored −48, the worst of the match. An 8-goal lead became a 1-goal deficit inside 19 minutes.

Attacking location map

Section 5.8
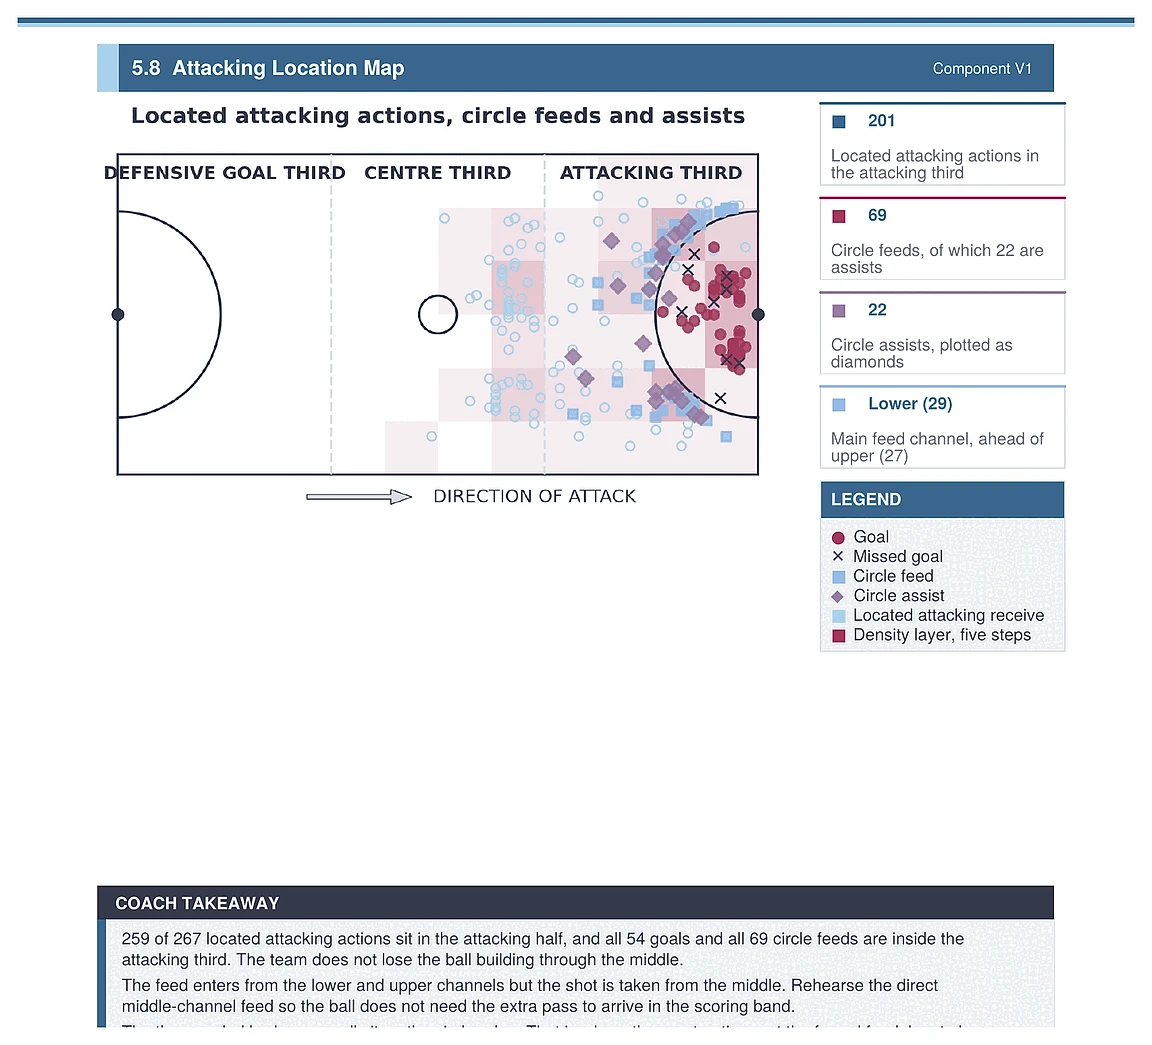
Court map plotting attacking actions, circle feeds and assists by third
Why it mattersEvery coded attacking action plotted on the court. 269 of 387 sit in the attacking half — the ball reaches the circle, the question is what happens next.

Shot map

Section 10.5
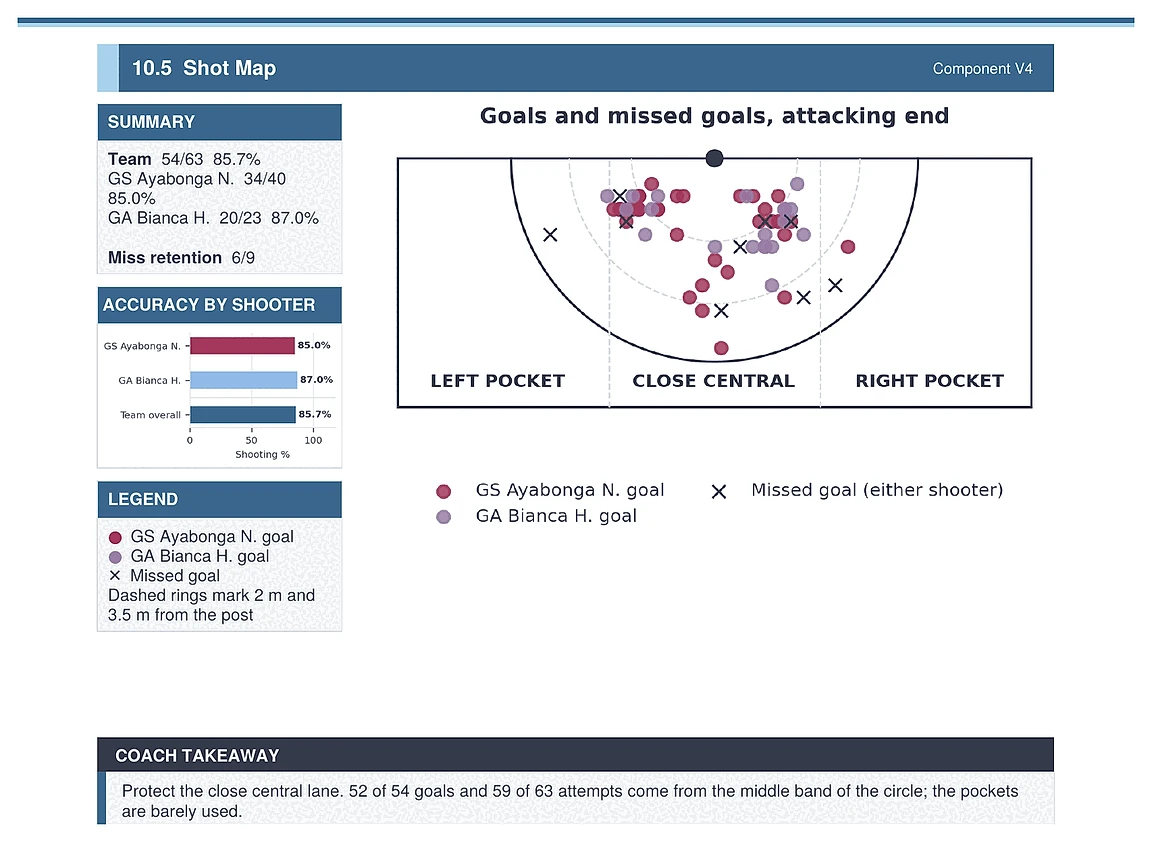
Goal circle shot map showing goals and missed goals by shooter with accuracy breakdown
Why it matters52 of 54 goals came from the middle band of the circle. The pockets are barely used — a defensive instruction the opposition will have already worked out.

Discipline and error profile

Section 11
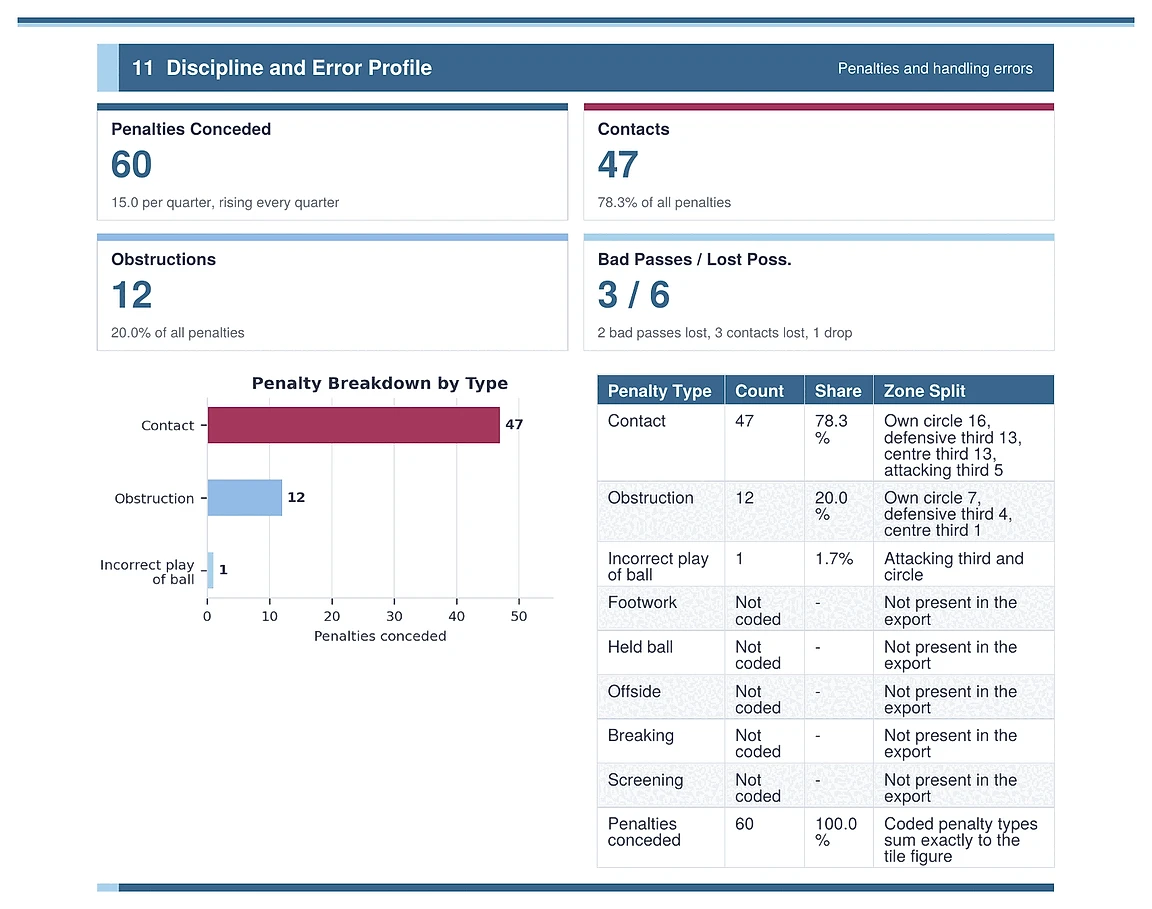
Penalties conceded breakdown by type with zone splits
Why it matters60 penalties broken to the offence and the court zone. 40 sit in the defensive goal third and own circle, against a side converting 66% of its centre passes.

Coach insight blocks

Section 1 · page 1
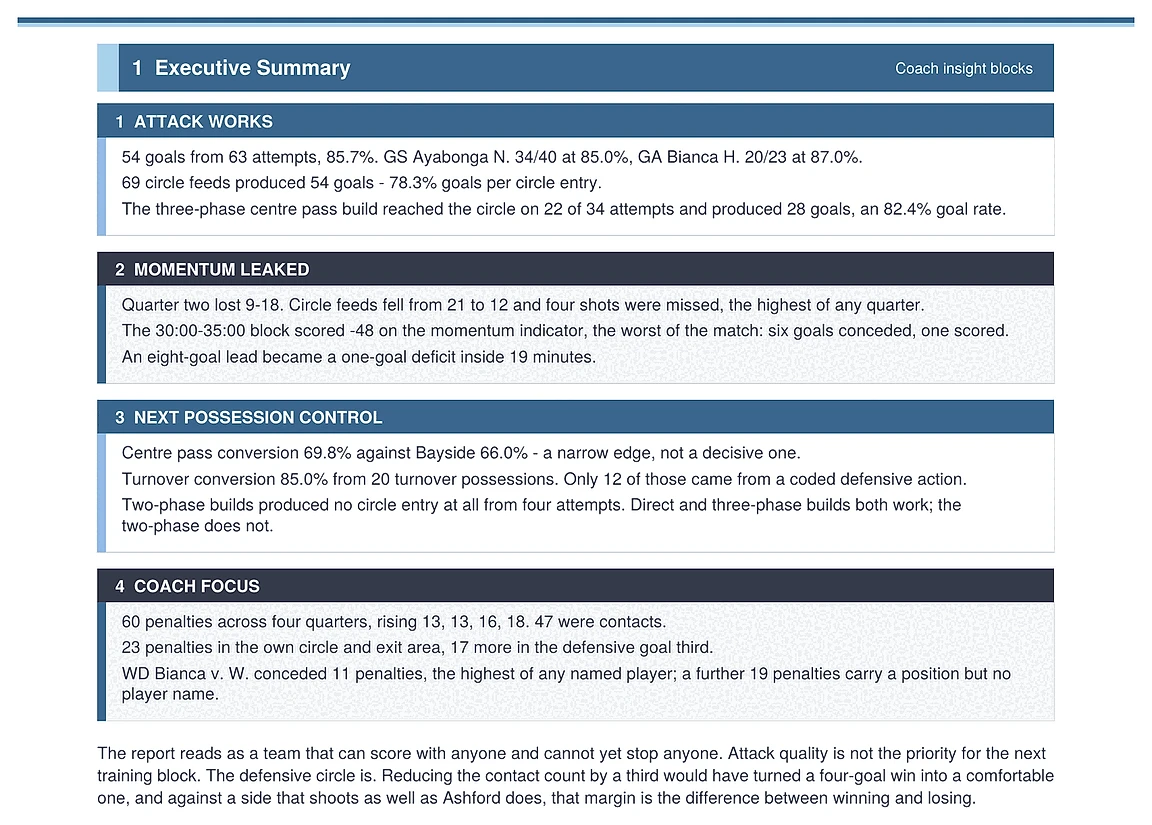
4 coach insight blocks covering attack, momentum, possession control and coaching focus
Why it mattersAttack works, momentum leaked, next-possession control, coach focus. 4 blocks that fit on 1 page and settle what the next training block is for.

Tactical plan

Section 16
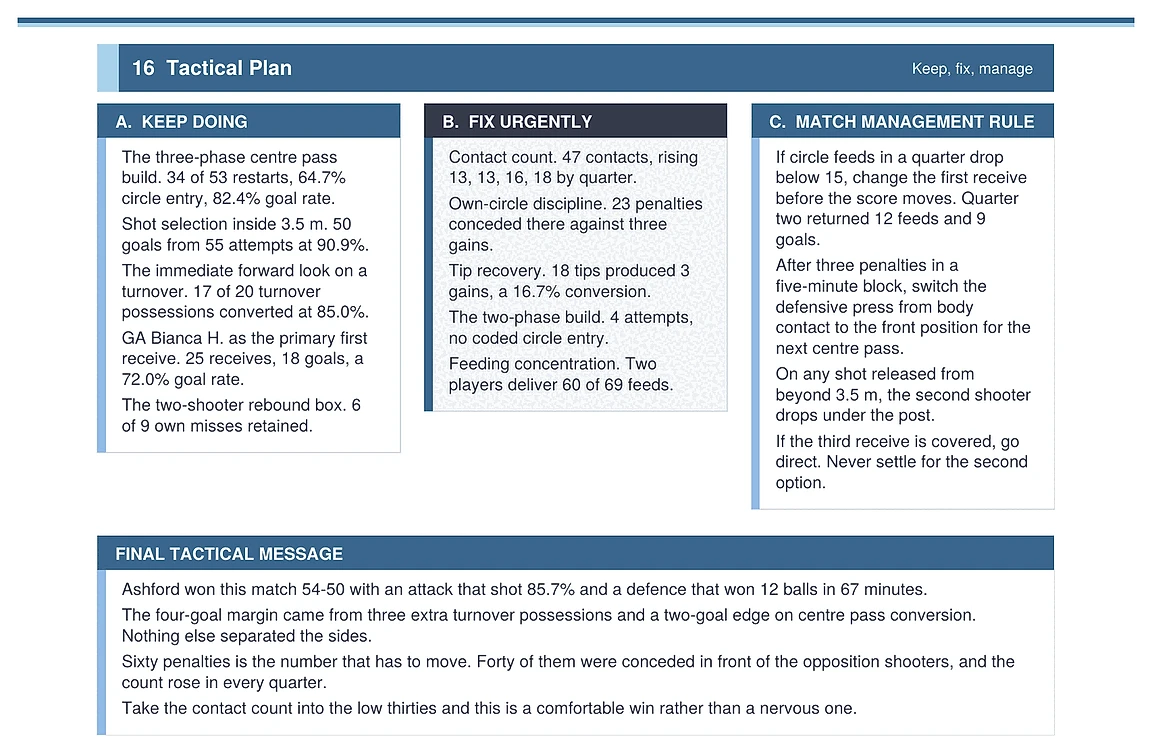
3-column tactical plan: keep doing, fix urgently, match management rule
Why it mattersKeep doing, fix urgently, match management rule — then a final tactical message written to be read out.

Contents

23 sections across 37 pages.

Attack, defence, conversion, shooting, discipline, court zones, players, units, then the plan for the next match. The 7 marked below are the ones shown on this page.

01Executive Summaryshown above
02Team Sheet
03Scoring Dashboardshown above
04Momentum Dashboardshown above
05Attacking Profileshown above
06Attack Outcome Summary
07Defensive Profile
08Defensive Outcome Summary
09Centre Pass and Turnover Conversion
10Shooting and Circle Analysisshown above
11Discipline and Error Profileshown above
12Court-Zone Analysis
13Player and Unit Performance
14Player Impact Summary
15Unit Analysis
16Tactical Planshown above
17Training Focus
18Video Review and Playlist
19Momentum and Turning Points
20Final Coach Notes
21Player Development Focus
22Appendix A — Metric Definitions
23Data Notes and Limitations

How you get it

Code the match. Run the report. Download it.

Reporting is built into Sportivo. There is nothing to send and no one to wait for — player coding is what drives the depth, and it is what makes a feed share, a shooter accuracy split and an individual development focus possible.

Inside the platform

3 STEPS

  • Code the match in Sportivo as you already do
  • Run the report from the fixture — your line-up is already there
  • Download the PDF and take it into the review

Player coding

37 PAGES · 23 SECTIONS

  • Every coded action attributed to a named player and position
  • Shooter-by-shooter accuracy and circle feed share
  • Unit analysis across shooters, midcourt, defence and bench
  • Individual development focus per player

Built for the court

NETBALL SPECIFIC

  • Circle entry and feeding maps plotted on the court
  • Shot map by distance and circle position, split by shooter
  • Centre pass build patterns — direct, 2-phase and 3-phase
  • Penalties broken down by court zone

Read a real netball report before you decide.

An abridged extract from the Ashford v Bayside demonstration fixture. Real coded data, real analysis, no real school.

© Sportivo 2026 · Sportivo Performance Analysis Ashford High School and Bayside High School are demonstration fixtures. All players and results are fictional.