SPORTIVO

Rugby Union · AI Performance Analysis

ASHFORD HIGH SCHOOL 1st XV  v  BAYSIDE HIGH SCHOOL 1st XV
22 AUG 2026  ·  LOST 14–57  ·  37 PAGES  ·  PLAYER CODING

The report starts with

“The coded picture is not a team that failed to compete for the ball — it is a team that could not hold the ball or its own set piece long enough to build pressure.”

Ashford lost 14–57. 37 pages later the report has named the cause, ranked the fix and listed the clips to watch — own lineout security first, then ball security in contact, then tackle accuracy.

7:15Ashford score first. Lead 7–0 for 11 minutes.
17:57First of 4 tries conceded inside 20 minutes.
28:45Yellow card. 2 tries conceded a man down.
71:55Second try, off a lineout platform inside the 22.
75:32Conceded again 3.6 minutes after scoring.
6/15Own lineouts won — 40% retention
75.5%Tackle completion, 26 missed
8 of 11Penalties conceded at the ruck
3.26sAverage ruck speed across 74 rucks
25 of 34Attacking sequences that gained territory

What a rugby report looks like

Every number arrives attached to a coaching instruction.

A count on its own tells a coach nothing they did not already feel on the touchline. What follows are real pages from a real report format — the fixture is a demonstration match, the analysis is the production output.

Match KPI dashboard

Section 1 · page 1
Rugby match KPI dashboard showing score, 22 entries, ruck speed, penalties, tries and tackles
Why it matters11 headline measures, each carrying the detail underneath it. “2 Tries Scored” is not the finding. “Both from a lineout platform” is.

Where the match was won and lost

Section 4 · 5-minute blocks
Table of 16 5-minute momentum blocks with cause, key players and coaching interpretation
Why it matters16 blocks, each with its cause, the players coded inside it, and where to start the video review. The 20–25 minute block is named as the priority clip before the coach opens the footage.

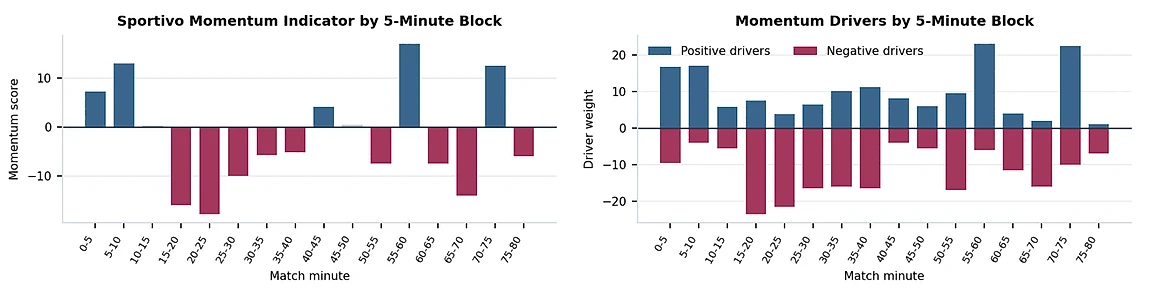
Momentum indicator

Section 4
2 bar charts showing the momentum indicator and its drivers by 5-minute block
Why it mattersA coaching proxy, not an official statistic. It shows which 5 minutes carried the edge.

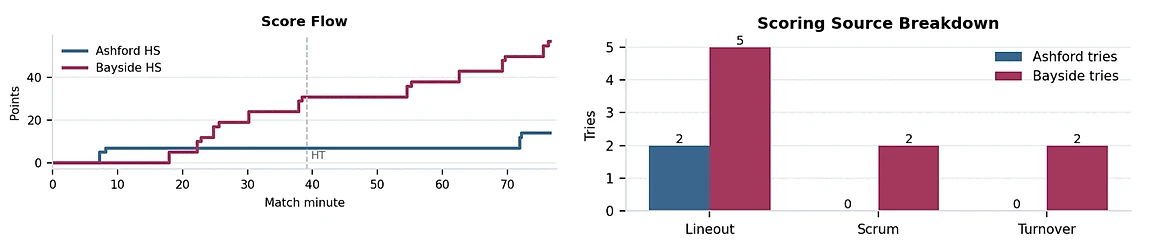
Score flow and sources

Section 3
Score flow line chart and scoring source breakdown bar chart
Why it matters5 of the opposition’s 9 tries came off the same platform. The chart makes the pattern impossible to miss.

Coach insight blocks

Section 1 · page 1
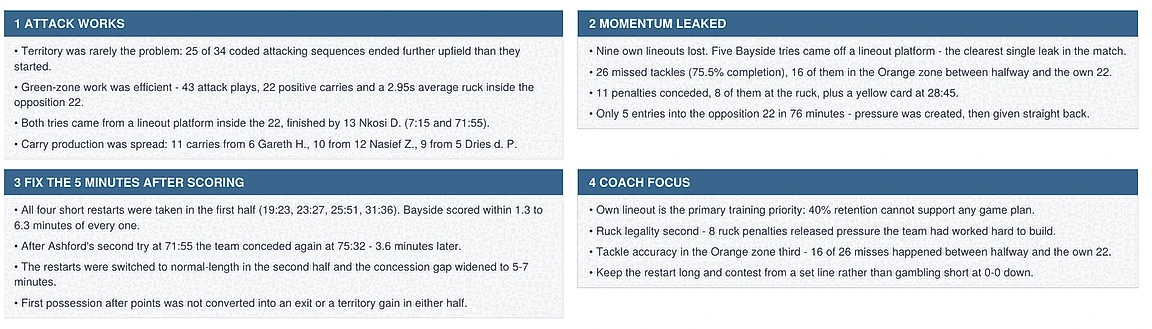
4 coach insight blocks covering attack, momentum, restarts and coaching focus
Why it mattersWhat works, where momentum leaked, the specific match-management fault, and the ranked training priority. This is the page a director of rugby reads.

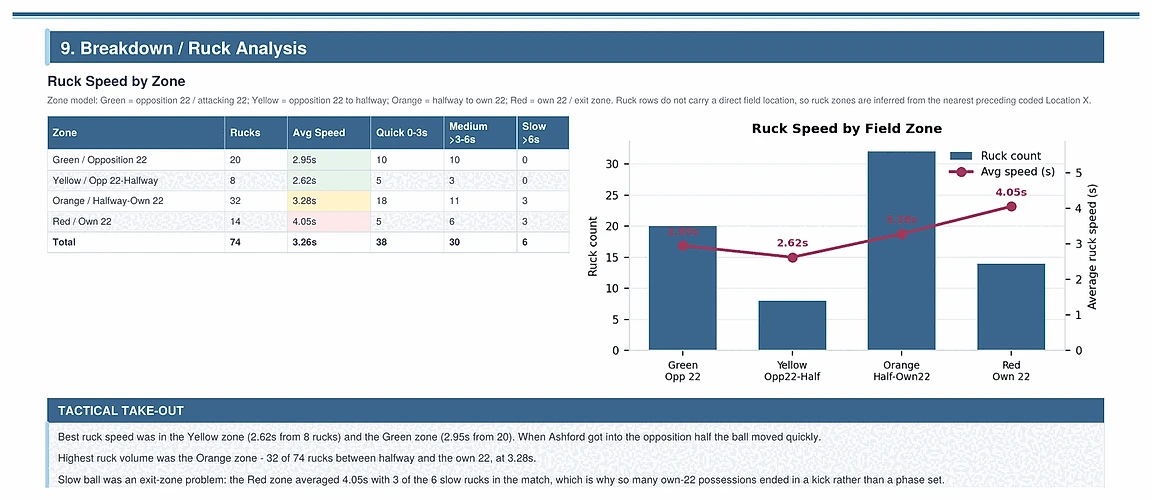
Breakdown and ruck speed

Section 9
Ruck speed by zone table and chart with tactical take-out
Why it mattersRuck speed split by field zone. Quickest ball came in the opposition half at 2.62s, slowest in the exit zone at 4.05s — which is why so many own-22 possessions ended in a kick instead of a phase set.

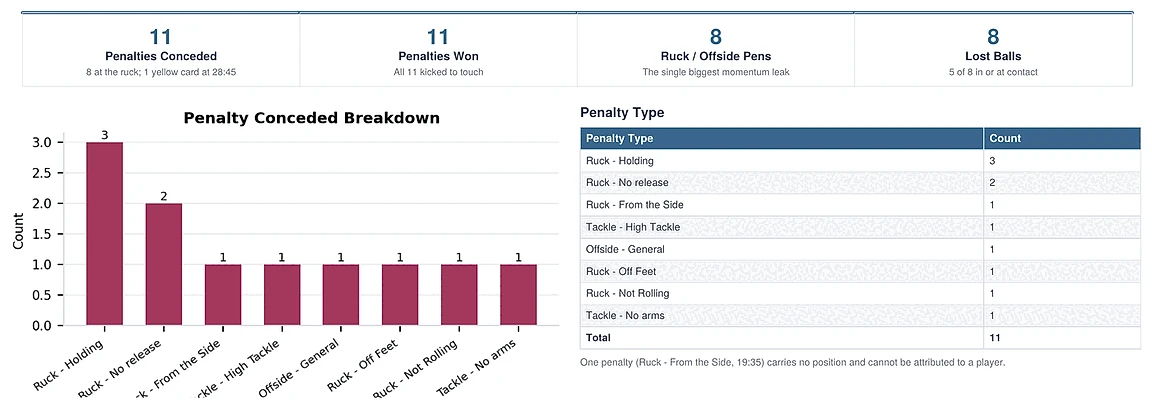
Discipline profile

Section 11
Penalty concede breakdown chart and penalty type table
Why it mattersPenalties broken to the offence, not just counted. Holding on, 3 times.

Player impact summary

Section 15
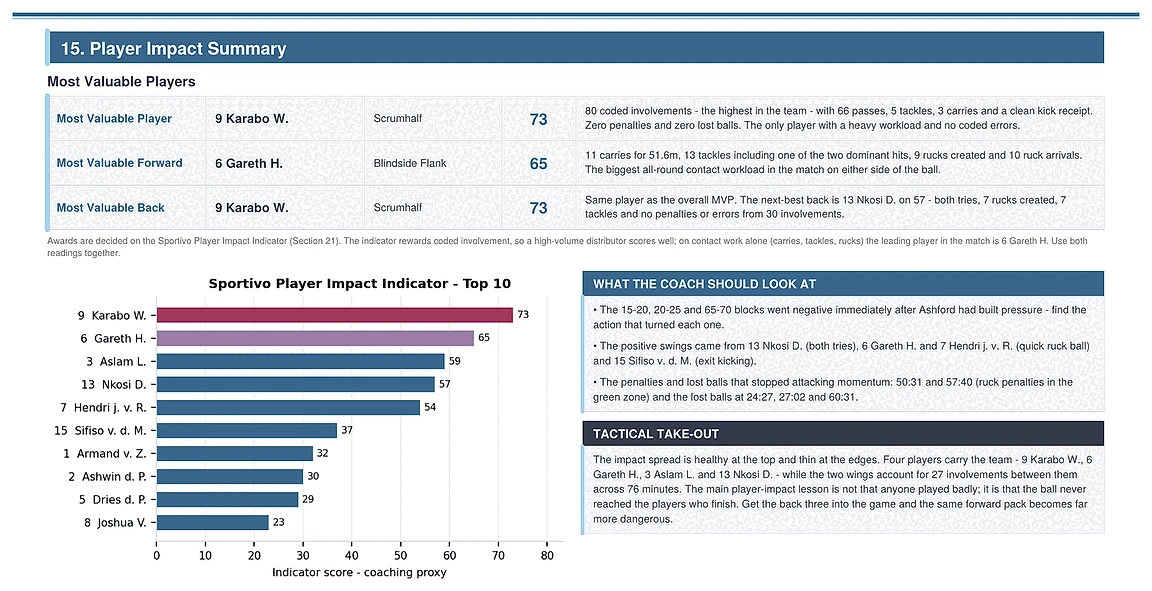
Most valuable players table and player impact indicator bar chart
Why it mattersMost valuable player, forward and back, each with the coded evidence behind the award and a caution about how to read it.

Tactical plan for the next match

Section 17
3-column tactical plan: keep doing, fix urgently, match management rule
Why it mattersKeep doing, fix urgently, match management rule. The report ends with instructions, not a summary.

Contents

22 sections across 37 pages.

Every section carries a coaching interpretation. The 7 marked below are the ones shown on this page.

01Executive Summaryshown above
02Team Sheet
03Scoring Dashboardshown above
04Momentum Dashboardshown above
05Attack Profile
06Offence / Attack Sequence Analysis
07Defence Profile
08Defence Sequence Analysis
09Breakdown / Ruck Analysisshown above
10Set Piece Analysis
11Discipline and Error Profileshown above
12Territory and Field-Zone Analysis
13Kicking and Exit Strategy
14Player and Unit Performance
15Player Impact Summaryshown above
16Position Unit Analysis
17Tactical Plan for the Next Matchshown above
18Training Focus
19Video Review / Playlist
20Final Coach Notes
21Appendix A — Metric Definitions
22Data Notes and Limitations

How you get it

Code the match. Run the report. Download it.

Reporting is built into Sportivo. There is nothing to send and no one to wait for — the only thing that changes the depth of the report is how the match was coded.

Inside the platform

3 STEPS

  • Code the match in Sportivo as you already do
  • Run the report from the fixture — your line-up is already there
  • Download the PDF and take it into the review

Player coding

37 PAGES · 22 SECTIONS

  • Every coded action attributed to a named player
  • Player impact summary and individual development focus
  • Position unit analysis across front row, locks, loose forwards, halfbacks, midfield and outside backs
  • Sequence-by-sequence attack and defence breakdown

What it gives back

AFTER THE WHISTLE

  • Built from the coded record, not a manual re-watch
  • Video review priorities listed with match timestamps
  • Training focus written for the next block, not the last match

Read 9 pages of a real rugby report before you decide.

An abridged extract from the Ashford v Bayside demonstration fixture. Real coded data, real analysis, no real school.

© Sportivo 2026 · Sportivo Performance Analysis Ashford High School and Bayside High School are demonstration fixtures. All players and results are fictional.